
Charts Helper Functions
The Charts Helper Functions provide methods for generating and exporting various ECharts visualizations directly from your scripts. These visualizations can then be previewed in the ScriptBee UI.
Overview
All chart helper functions follow a similar signature. You must provide a name for the chart and a list of series data. Optionally, you can pass an ECharts configuration object (options) to further customize the visualization (e.g., axes, legends, tooltips).
public void Export[ChartType](
    string name,
    List<Dictionary<string, object>> series,
    Dictionary<string, object>? options = null
)
)Note: ScriptBee Default UI Plugin uses Apache ECharts for rendering. The
serieslist andoptionsdictionary directly map to ECharts configurations. For a complete list of what you can provide in theoptionsandseriesarguments, refer to the ECharts Configuration Manual and ECharts Examples.
Available Chart Types
1. Bar Chart
Exports a standard bar chart.
- ECharts Reference: series-bar
chartsHelper.ExportBarChart("MyBarChart", series, options);2. Scatter Plot
Exports a 2D scatter plot.
- ECharts Reference: series-scatter
chartsHelper.ExportScatterPlot("MyScatterPlot", series, options);3. Tree Map
Exports a hierarchical tree map visualization.
- ECharts Reference: series-treemap
chartsHelper.ExportTreeMap("MyTreeMap", series, options);4. Heatmap
Exports a heatmap chart.
- ECharts Reference: series-heatmap
chartsHelper.ExportHeatmap("MyHeatmap", series, options);5. Generic ECharts Chart
If you need to export an ECharts visualization that doesn't have a specific wrapper method, use the generic export method.
- ECharts Reference: Full Configuration
chartsHelper.ExportEChartsChart("MyCustomChart", series, options);6. Bubble Chart
Exports a bubble chart. A bubble chart is essentially a scatter plot where the markers (bubbles) vary in size depending on a third dimension of the data.
- ECharts Reference: series-scatter
chartsHelper.ExportBubbleChart("MyBubbleChart", series, options);7. Gantt Chart
Exports a Gantt chart. Because ECharts does not natively support Gantt charts, this is built using a custom series. It allows for advanced customization using metadata parameters (similar to the Bubble Chart).
- ECharts Reference: series-custom
chartsHelper.ExportGanttChart("MyGanttChart", series, options);Customizing Gantt Chart Rendering
When creating a Gantt Chart, you must specify the start time, end time, and category (Y-axis lane) for each task. You can pass specific metadata keys inside your series dictionaries to dictate how these values are extracted.
Supported Metadata Parameters
startIndex(int): If your data points are arrays, this tells the chart which index holds the start value/date. ( Defaults to0).endIndex(int): If your data points are arrays, this tells the chart which index holds the end value/date. ( Defaults to1).categoryIndex(int): If your data points are arrays, this tells the chart which index holds the category index. ( Defaults to2).startKey(string): If your data points are objects, this tells the chart which property key holds the start value/date.endKey(string): If your data points are objects, this tells the chart which property key holds the end value/date.categoryKey(string): If your data points are objects, this tells the chart which property key holds the category index.barHeightRatio(number): The ratio of the task block height relative to the category row height. (Defaults to0.6).borderRadius(number | array): The border radius of the task blocks. (Defaults to6).customStyle(object): Allows overriding the default ECharts block styles (e.g. shadows, strokes).
Example: Using Array Data
If your data is formatted as arrays [startTime, endTime, categoryIndex]:
var myTasks = new List<object>
{
    // [Start, End, CategoryIndex]
    new[] { 1655647200000, 1657980000000, 0 },
    new[] { 1657980000000, 1658980000000, 1 }
};

var series = new List<Dictionary<string, object>>
{
    new()
    {
        { "name", "Project Tasks" },
        { "data", myTasks },
        { "startIndex", 0 },           // Use the 1st element for start
        { "endIndex", 1 },             // Use the 2nd element for end
        { "categoryIndex", 2 }         // Use the 3rd element for category
    }
};

chartsHelper.ExportGanttChart("ProjectGanttChart", series);
Customizing Bubble Chart Sizes
When creating a Bubble Chart, the size of each point can be dynamically configured without needing to write custom JavaScript. You can pass specific metadata keys inside your series dictionaries to dictate how sizes are calculated.
Supported Metadata Parameters
sizeIndex(int): If your data points are arrays (e.g.,[x, y, size]), this tells the chart which index to use for the bubble size.sizeKey(string): If your data points are objects (e.g.,{ x: 10, y: 20, value: 50 }), this tells the chart which property key holds the bubble size.sizeMultiplier(number): A scaling factor applied to the extracted size. Useful if the raw data values are too small or too large to be displayed directly as pixel radii. (Defaults to1).defaultSize(number): The fallback size used if the designated index or key is not found on a data point, or if neithersizeIndexnorsizeKeyare specified. (Defaults to10).
Example 1: Using Array Data
If your data is formatted as arrays [x, y, size], you can tell the UI to scale the size using sizeMultiplier.
var myData = new List<object>
{
    new[] { 10, 20, 50 },
    new[] { 15, 25, 30 }
};

var series = new List<Dictionary<string, object>>
{
    new()
    {
        { "name", "Store Sales" },
        { "data", myData },
        { "sizeIndex", 2 },           // Use the 3rd element for size
        { "sizeMultiplier", 1.5 },    // Make the bubbles 1.5x larger
        { "defaultSize", 5 }          // Use size 5 if data is missing
    }
};

chartsHelper.ExportBubbleChart("SalesBubbleChart", series);
Example 2: Using Object Data
If your data points are dictionaries or JSON objects, you can use sizeKey to extract the size dynamically.
var myData = new List<object>
{
    new Dictionary<string, object> { { "x", 10 }, { "y", 20 }, { "population", 50000 } },
    new Dictionary<string, object> { { "x", 15 }, { "y", 25 }, { "population", 30000 } }
};

var series = new List<Dictionary<string, object>>
{
    new()
    {
        { "name", "City Populations" },
        { "data", myData },
        { "sizeKey", "population" },    // Look for the "population" key
        { "sizeMultiplier", 0.001 }     // Scale down large numbers to reasonable pixel sizes
    }
};

chartsHelper.ExportBubbleChart("PopulationBubbleChart", series);
Example:
How to write a Script that outputs a Bar chart
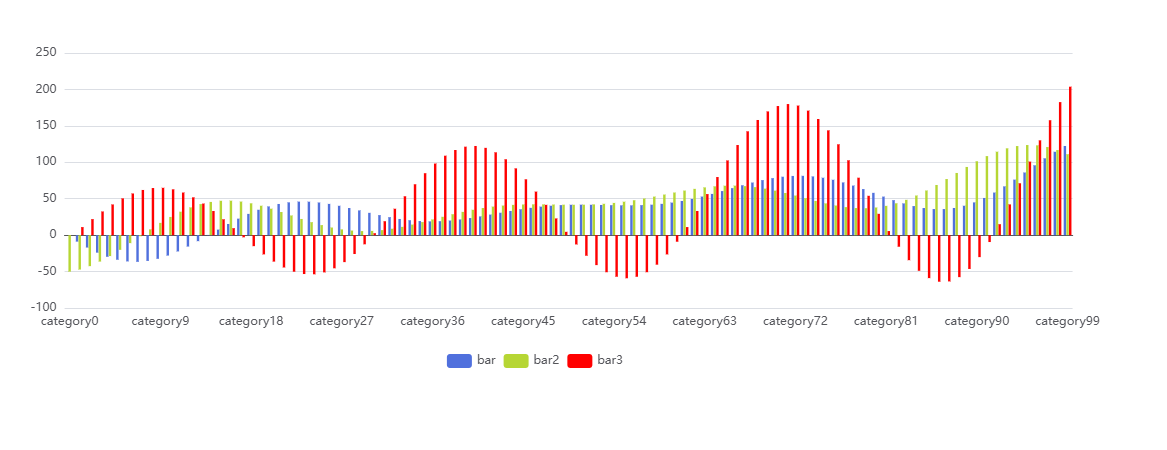
using System;
using System.Text;
using System.Linq;
using System.Collections.Generic;
using ScriptBee.Domain.Model.Context;
using DxWorks.ScriptBee.Plugin.Api;
using DxWorks.ScriptBee.Plugin.Api.Model;
using static DxWorks.ScriptBee.Plugin.Api.HelperFunctions;


// Only the code written in the ExecuteScript method will be executed

public class ScriptContent
{
    public void ExecuteScript(Project project)
    {
        ConsoleWriteLine("Start");

        var xAxisData = new List<string>();
        var data1 = new List<double>();
        var data2 = new List<double>();
        var data3 = new List<double>();

        ConsoleWriteLine("Populate the data using Math functions");
        for (int i = 0; i < 100; i++)
        {
            xAxisData.Add("category" + i);
            data1.Add((Math.Sin(i / 5.0) * (i / 5.0 - 10.0) + i / 6.0) * 5.0);
            data2.Add((Math.Cos(i / 5.0) * (i / 5.0 - 10.0) + i / 6.0) * 5.0);
            data3.Add((Math.Sin(i / 5.0) * (i / 5.0 + 10.0) + i / 6.0) * 5.0);
        }

        ConsoleWriteLine("done populate");

        var series = new List<Dictionary<string, object>>
        {
            new Dictionary<string, object>
            {
                { "name", "bar" },
                { "data", data1 }
            },
            new Dictionary<string, object>
            {
                { "name", "bar2" },
                { "data", data2 }
            },
            new Dictionary<string, object>
            {
                { "name", "bar3" },
                { "data", data3 },
                { "color", "red" }
            }
        };

        var options = new Dictionary<string, object>
        {
            {
                "xAxis", new Dictionary<string, object>
                {
                    { "data", xAxisData },
                    { "silent", false },
                    { "splitLine", new Dictionary<string, object> { { "show", false } } }
                }
            },
            { "yAxis", new Dictionary<string, object>() },
            {
                "legend", new Dictionary<string, object>
                {
                    { "data", new List<string> { "bar", "bar2", "bar3" } },
                    { "align", "left" }
                }
            },
            { "tooltip", new Dictionary<string, object>() },
            { "animationEasing", "elasticOut" }
        };

        ExportBarChart("Bar chart", series, options);
        ConsoleWriteLine("Done");
    }
}